
Chapter 3: Beyond Piketty—The Laffer Curve is Alive and Well
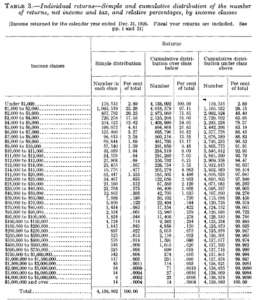
An example of how we count average income of the top 1 percent, for our research on average tax revenues from that group, may be seen in the following examples from the 1926 Statistics of Income of the Treasury Department, Internal Revenue office. The first table (from page 77) indicates the total number of individual filers, 4,138, 092. The top 1 percent of these is the top 41,381 filers.
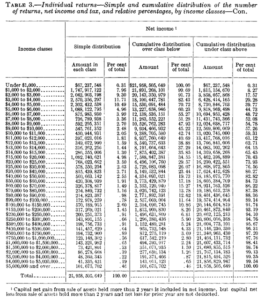
In the second table (from page 78), 21.958 billion is given as total income reported by all filers. In the same table, the top circa 41,400 filers were those with income over $40,000. The total income of these people added up to somewhat over $4 billion in total, or just over $100,000 per filer. This figure was the average income for a member of the top 1 percent in 1926.
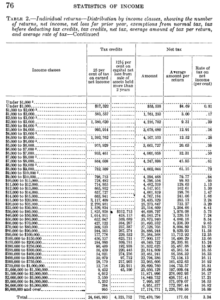
Total tax revenues of the top 1 percent are those in the table below (from p. 76) for income greater than $40,000. Total revenues of the top 1 percent divided by the number in the top one percent is average revenue from a member of the top 1 percent.
After adjusting for inflation (and baseline economic growth), average tax revenues from the top 1 percent from each year to next are largely comparable with each other. This is particularly so when the total number of filers (and therefore the total number within the top 1 percent) are of similar size. Such periods are pre-1917, 1917-late 1930s, and post-1943.
Also see the IRS Tax Stats where such information can be accessed.