
Chapter 1: Whatever
1. The favorite business book of both Bill Gates and Warren Buffett, John Brooks Business Adventures of 1969, provided the epigraph for Taxes Have Consequences:
From John Brooks, Business Adventures: Twelve Classic Tales from the World of Wall Street and the Modern Corporation (New York: Weybright and Talley, 1969), 78
2. The Sixteenth Amendment to the Constitution:
The Congress shall have power to lay and collect taxes on incomes, from whatever source derived, without apportionment among the several States, and without regard to any census or enumeration.
Prior to this amendment’s ratification in 1913, an income tax had to reflect each state’s relative share of the national population. If New York had 10 percent of the national population, for example, it had to provide 10 percent of a federal income tax’s revenue. The 16th Amendment (of 1913) did away with this distinction. It enabled a federal income tax “without regard to any census or enumeration” of each state’s share of the national population.
Why the income tax came about is a curious story in American history. Tariff customs and alcohol taxes accounted for virtually all federal revenue by the early twentieth century. The tariff had been a political football for all of the nation’s history—and the chief subject of Congressional discourse since 1789. Reform of the tax system was a centerpiece of the immense popular economic movement associated with the wild popularity of Henry George’s 1879 book Poverty and Progress, which argued for a “single tax” on the unimproved value of land. The formidable temperance movement wanted an alternative source of revenue such that alcohol could be banned (as happened in 1919). Intellectual historians have argued, unsuccessfully in Dr. Brian Domitrovic’s estimation, that enlightened European nudging of Americans towards consideration of an income tax helped bring about the 16th Amendment.
Dr. Domitrovic’s article on this subject is here.
3. Income tax brackets from 1913-2013 are here in pdf form from the Tax Foundation. These rates were the “paper rates” that began the discussion each year about taxes owed. The innumerable exceptions to these paper rates made up the bulk of the tax code.
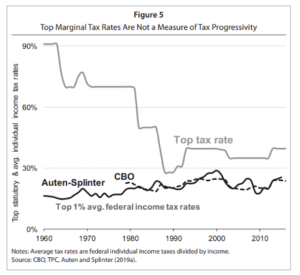
4. The stability of the top “effective” tax rates of the top 1% is explored in:
David Splinter, U.S. Tax Progressivity and Redistribution, National Tax Journal 74, no. 4 (Dec. 2020), 1005-1024, accessible here.
This is the graph in this article displaying the stability of top “average” tax rates of the top 1%:
Some terms of art in income tax language:
- “Statutory” tax rates (also “paper rates”) are those posted in the rate schedules.
- “Marginal” tax rates are those one faces on the last dollar of income.
- “Average” tax rates are taxes divided by income.
- “Effective” tax rates are the rates one faces after the whole of the tax code is taken into consideration beyond the statutory rates.
5. The tax-free yearly million-dollar-plus income of Mrs. Horace Dodge, care of municipal bonds, was notorious throughout the middle decades of the twentieth century. See:
Encyclopedia of Municipal Bonds: A Reference Guide to Market Events, Structures, Dynamics, and Investment Knowledge, ed. Joe Mysak (Hoboken, NJ: John Wiley & Sons, 2012), 51:
Mrs. Dodge was an example, at times, of the super-top 1% doing questionable things with its money. Here is a Noguchi sculpture she commissioned for Detroit:
 6. Historical tax revenue and collection data from the Internal Revenue Service (and its predecessors) may be found in the publications, from over the years, of the series Statistics of Income.
7. The Piketty-Saez U-shaped curve from Piketty, Capital in the 21st Century.
The difference in method in calculating income shares, on the part of Piketty/Saez and in Taxes Have Consequences in the section on tax revenues from the rich, is as follows. Piketty/Saez strive to identify all national income in each year and assign each portion of it to an income group. The income groups are portions of the total national population divided by four, or “tax units” theoretically corresponding to average family size.
The average tax revenue parts of Taxes Have Consequences take income as reported to the IRS. Income groups are percentages of total tax filers. The U-shaped curves of the share of the income of the top 1% under each method are similar.